Instrumenting .NET Applications with net_profiler_rust
net_profiler_rust is a side project I created to make monitoring everyday .NET applications easier. The profiler is implemented in Rust.
Feel free to try it and let me know what could be improved.
net_profiler_rust adds OpenTelemetry tracing and metrics to .NET applications without requiring source-code changes or additional NuGet packages. It uses the .NET profiling API, starts the OpenTelemetry SDK inside the application, and sends telemetry over OTLP.
This short guide uses Dynatrace first and then shows how to send the same telemetry to an OpenTelemetry Collector and Jaeger.
Download the agent
Download the package for your operating system and CPU architecture from the net_profiler_rust download page:
linux-x64orlinux-arm64osx-arm64for Apple Siliconwindows-x64
Extract the archive. The package contains the native profiler, managed agent assemblies, example settings, and scripts for starting an application with the profiler enabled.
macOS: remove the quarantine attribute
macOS adds a quarantine attribute to files downloaded from the internet. This can prevent .NET from loading the native profiler. After verifying that the archive came from the download page, remove the attribute from the extracted agent directory:
xattr -lr ./profiler-deployment-osx-arm64
xattr -dr com.apple.quarantine ./profiler-deployment-osx-arm64
Complete macOS example
The following example creates a small .NET 10 console application on an Apple Silicon Mac and sends a custom method span to Dynatrace.
Create the application:
mkdir otel-agent-demo
cd otel-agent-demo
dotnet new console -n DemoApp --framework net10.0 --use-program-main
cd DemoApp
Replace Program.cs with:
namespace DemoApp;

internal static class Program
{
    private static void Main()
    {
        var result = Calculator.Calculate(21);
        Console.WriteLine($"Result: {result}");
    }
}

internal static class Calculator
{
    public static int Calculate(int input)
    {
        Thread.Sleep(250);
        return input * 2;
    }
}
Publish it for Apple Silicon:
dotnet publish -c Release -r osx-arm64 --self-contained false
Create settings/settings.yaml inside the extracted agent directory:
General:
  Enabled: true
  Provider: dynatrace
  Type: custom

Connection:
  EndpointUrl: https://<your-environment>.live.dynatrace.com/api/v2/otlp
  Type: http
  BearerToken: <your-api-token>

Monitoring:
  ServiceName: macos-demo
  Enabled: true
  Metrics:
    ServiceName: macos-demo
    Enabled: true
    CollectionInterval: 2
    Cpu: true
    Memory: true

EntryPoint:
  Assembly: DemoApp
  Type: DemoApp.Program
  Method: Main

Sources:
  - Name: Demo.Calculate
    Type: DemoApp.Calculator
    Method: Calculate
    Kind: Internal
    Capture:
      Parameters:
        - Index: 0
          Name: input
Run the application from the extracted agent directory:
cd /path/to/profiler-deployment-osx-arm64

AGENT_SETTINGS_PATH="$PWD/settings" \
  ./bin/run-with-profiler.sh \
  dotnet /path/to/otel-agent-demo/DemoApp/bin/Release/net10.0/osx-arm64/publish/DemoApp.dll
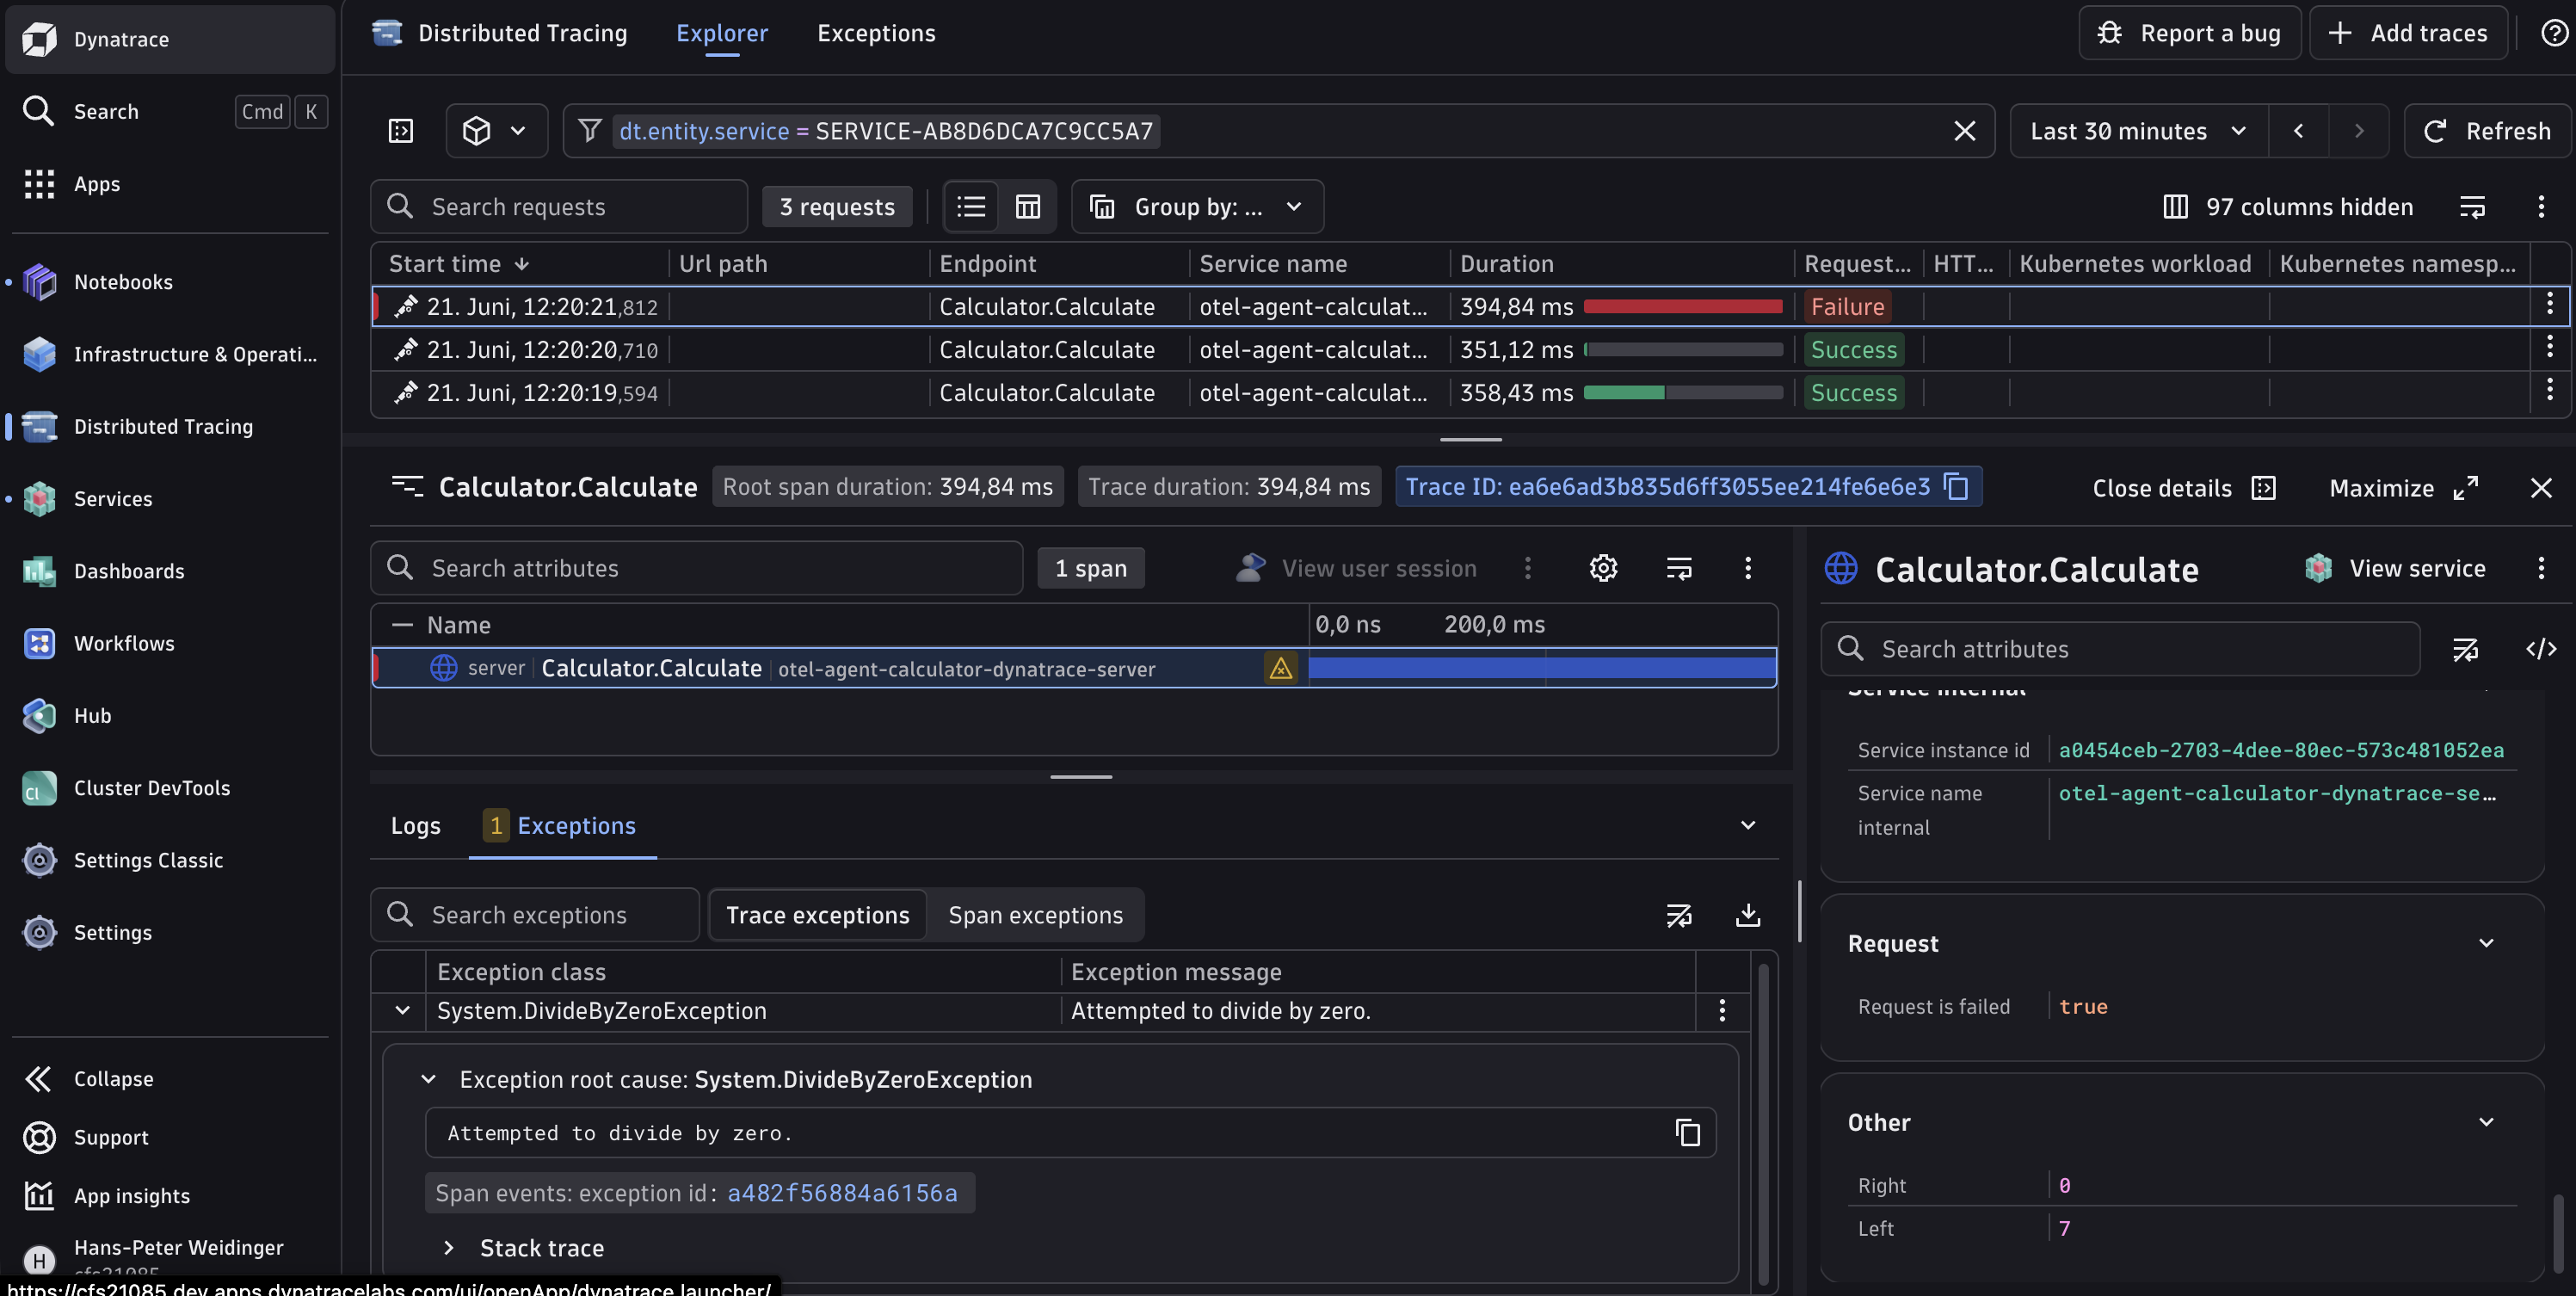
The application prints Result: 42. In Dynatrace, look for the macos-demo service and a Demo.Calculate span containing the input=21 attribute. Short-lived applications may exit before the first periodic metric export; use a longer-running application when testing metrics.
ASP.NET Core with Dynatrace
Create a directory containing a settings.yaml file:
General:
  Enabled: true
  Provider: dynatrace
  Type: aspnetcore

Connection:
  EndpointUrl: https://<your-environment>.live.dynatrace.com/api/v2/otlp
  Type: http
  BearerToken: <your-api-token>

Monitoring:
  ServiceName: demo-api
  Enabled: true
  Special:
    - HttpClientInstrumentation
  Metrics:
    ServiceName: demo-api
    Enabled: true
    CollectionInterval: 10
    Cpu: true
    Memory: true
The Dynatrace API token needs openTelemetryTrace.ingest and metrics.ingest. See the current Dynatrace OTLP API documentation when creating the token.
Start a published ASP.NET Core application:
cd profiler-deployment-<platform>

AGENT_SETTINGS_PATH=/absolute/path/to/settings \
  ./bin/run-with-profiler.sh dotnet /absolute/path/to/DemoApi.dll
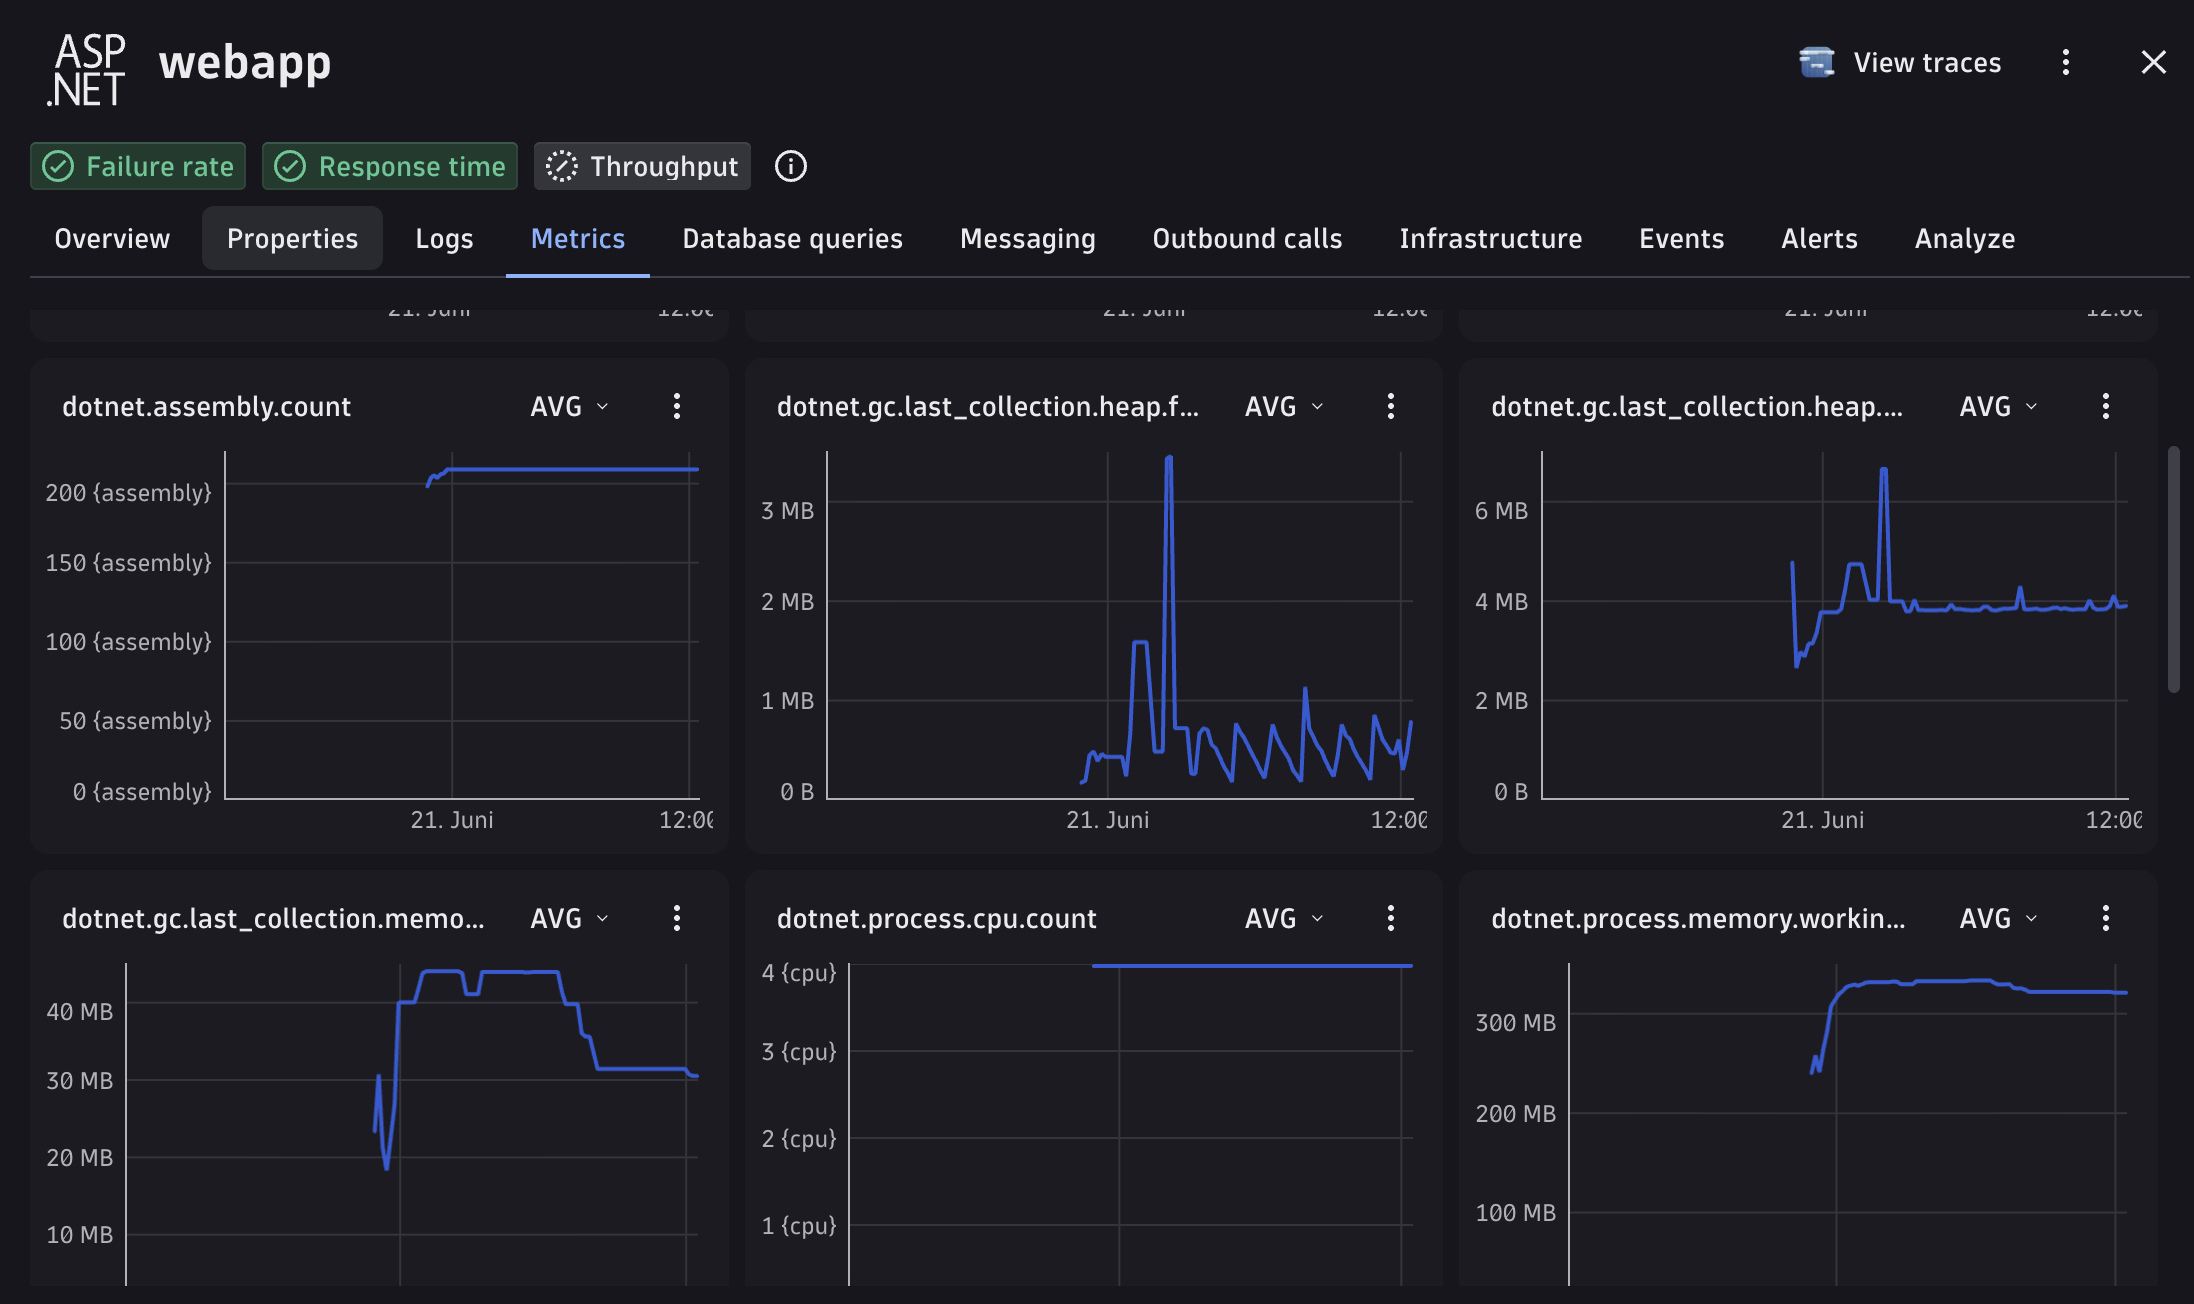
Incoming ASP.NET Core requests and outgoing HttpClient calls now produce traces. The agent also exports ASP.NET Core, HTTP client, runtime, and process metrics. Runtime and process metrics require .NET 9 or newer.
Using Jaeger instead
The agent is not tied to Dynatrace. To send OTLP to a local OpenTelemetry Collector, change the provider and connection:
General:
  Enabled: true
  Provider: otel
  Type: aspnetcore

Connection:
  EndpointUrl: http://localhost:4317
  Type: grpc
A minimal Collector pipeline can forward traces to Jaeger and expose metrics for Prometheus:
receivers:
  otlp:
    protocols:
      grpc:

exporters:
  otlp/jaeger:
    endpoint: jaeger-collector:4317
    tls:
      insecure: true
  prometheus:
    endpoint: 0.0.0.0:8889

service:
  pipelines:
    traces:
      receivers: [otlp]
      exporters: [otlp/jaeger]
    metrics:
      receivers: [otlp]
      exporters: [prometheus]
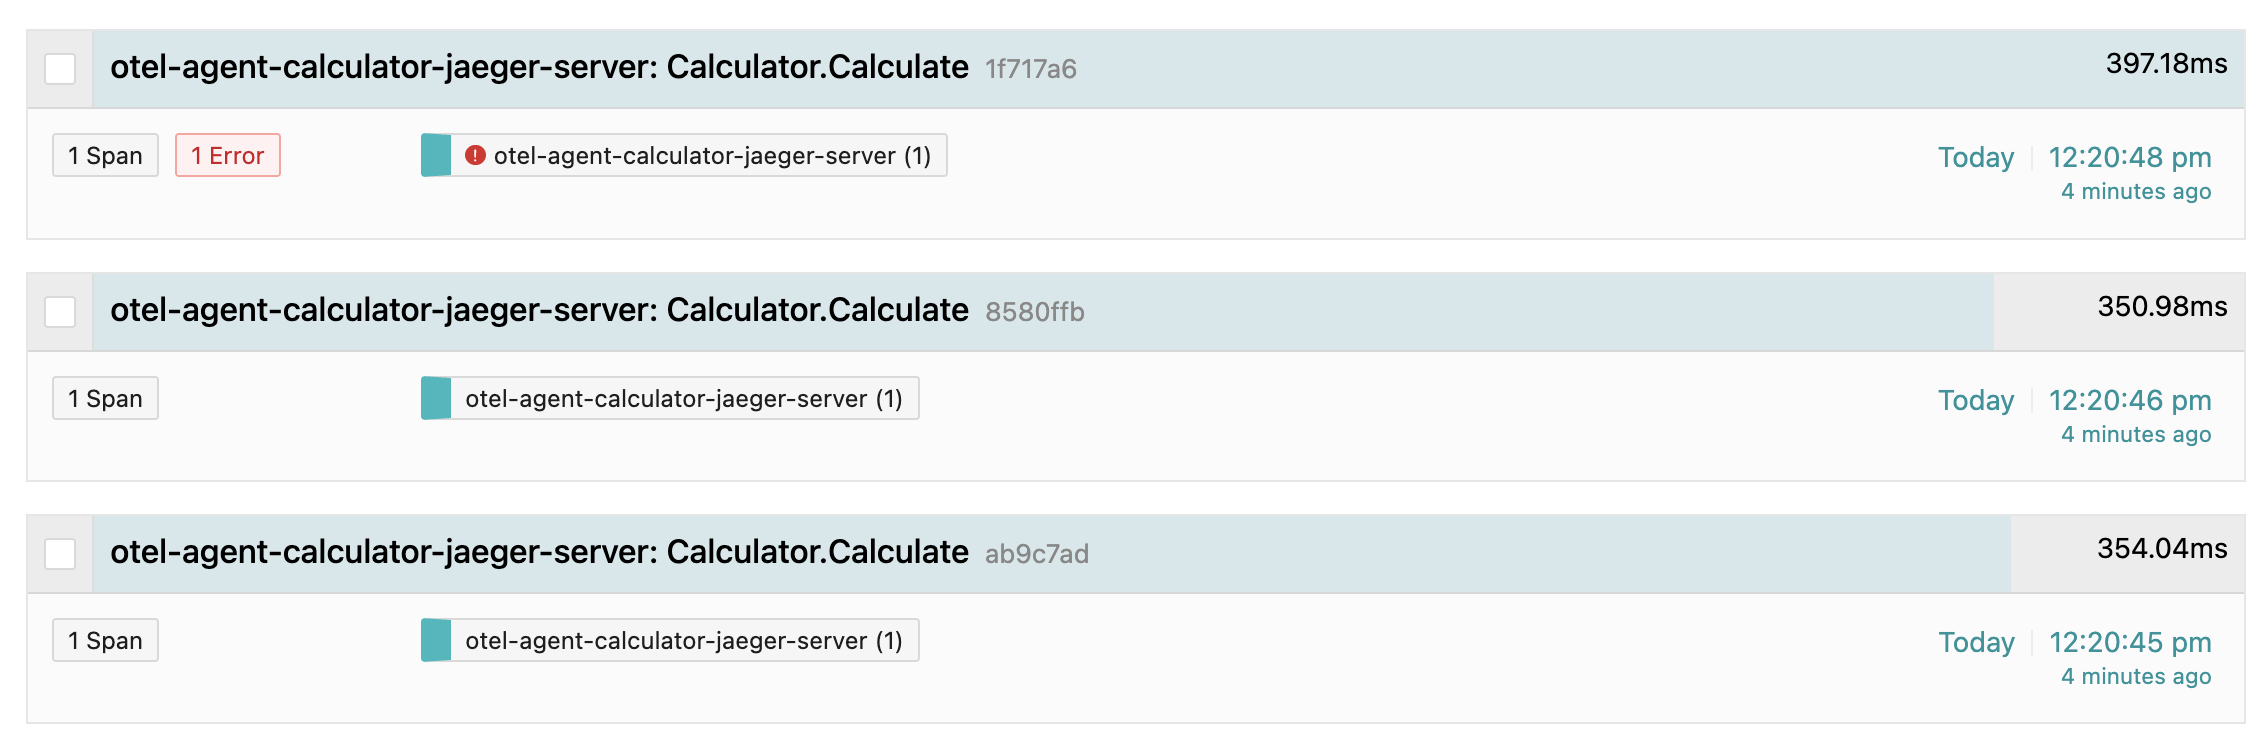
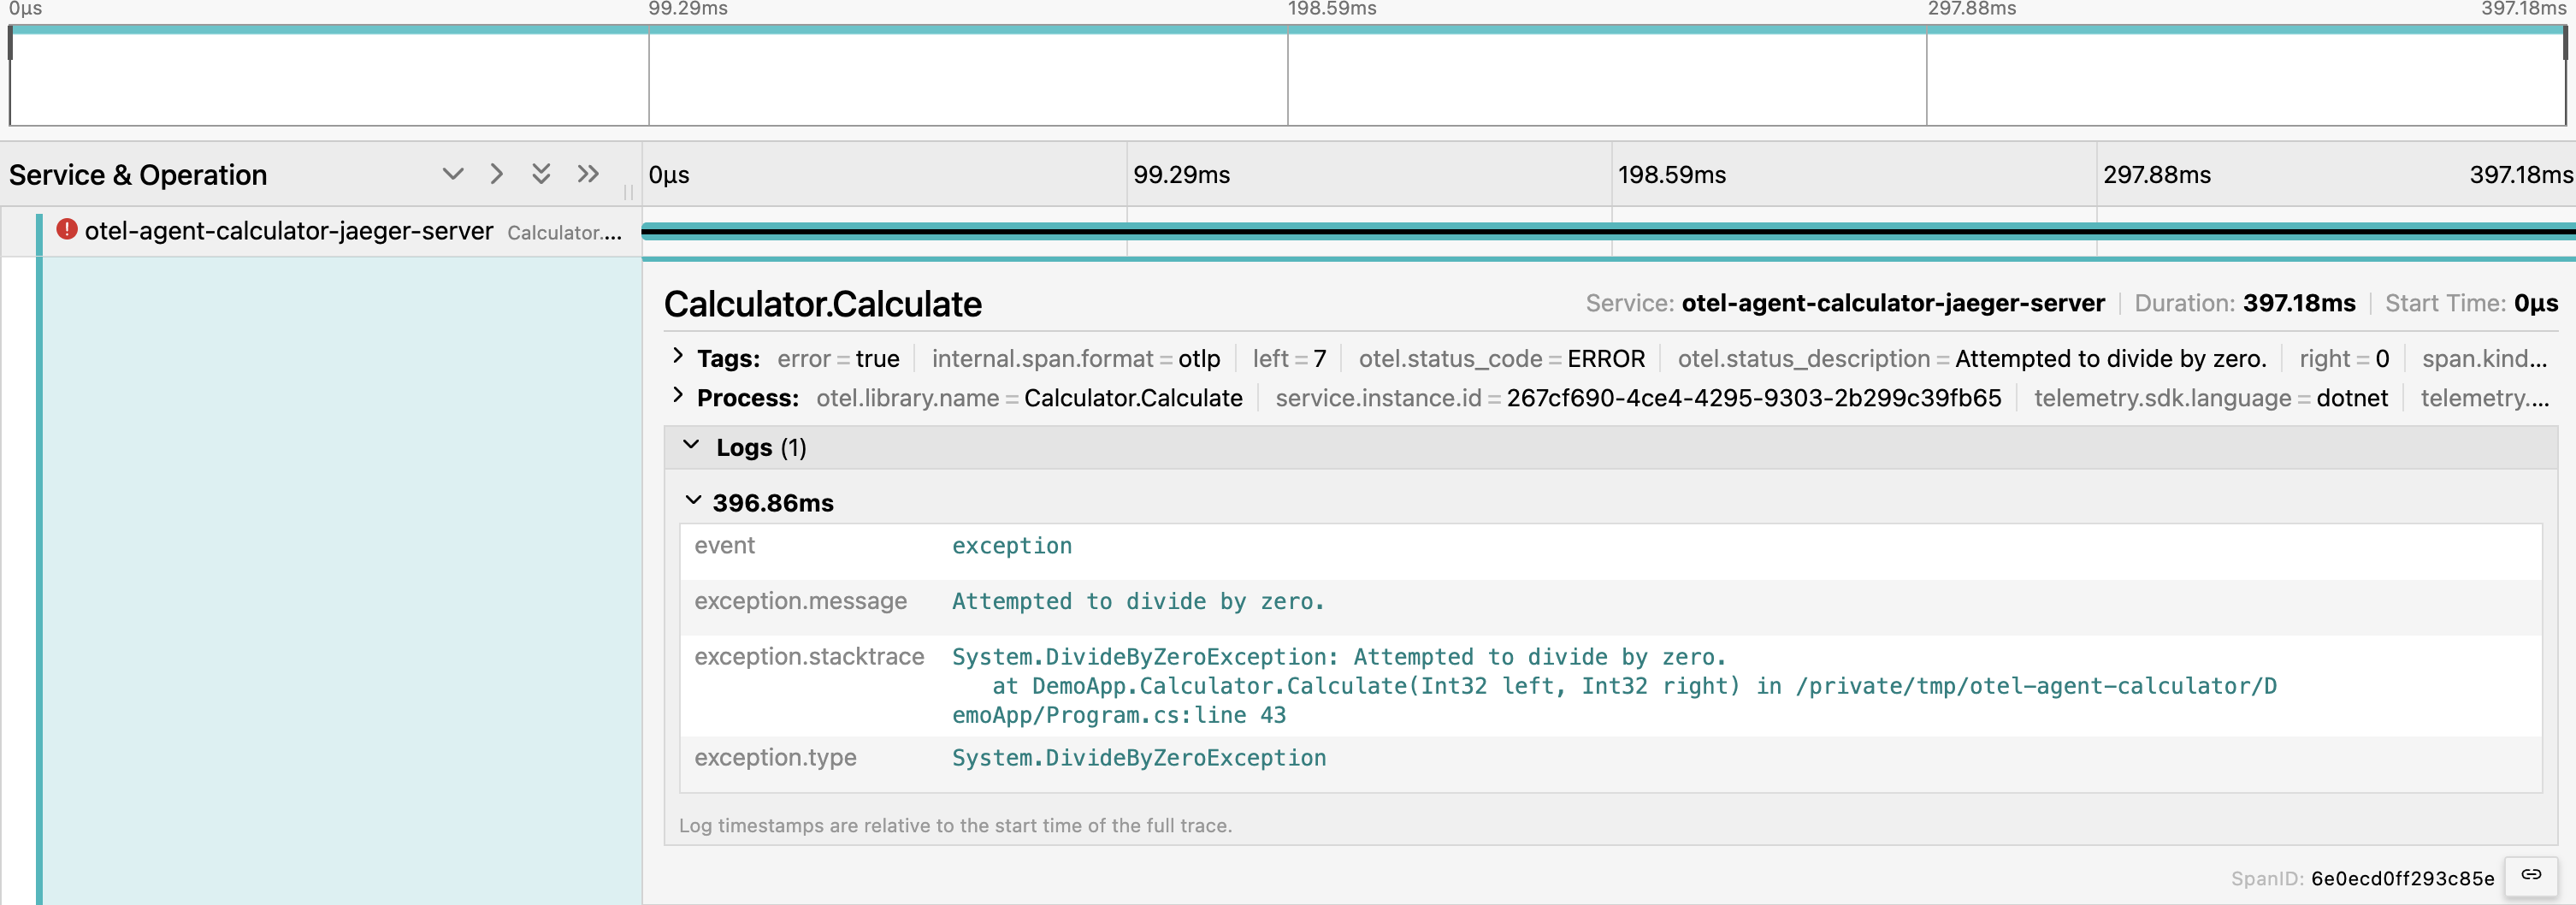
Jaeger displays the traces. Prometheus, usually together with Grafana, handles the exported metrics.
DivideByZeroException.Custom entry points and method rules
For a console application, worker, or other application without the ASP.NET Core host, use Type: custom and tell the agent where to initialize OpenTelemetry:
General:
  Enabled: true
  Provider: dynatrace
  Type: custom

EntryPoint:
  Assembly: DemoApp
  Type: DemoApp.Program
  Method: <Main>

Sources:
  - Name: Demo.Calculate
    Type: DemoApp.Calculator
    Method: Calculate
    Kind: Internal
    Capture:
      Parameters:
        - Index: 0
          Name: input
      Exceptions: true
EntryPoint identifies the method where the agent starts and stops the OpenTelemetry SDK. Each item under Sources creates spans for a selected method. In this example, the first argument of Calculate is recorded as the input span attribute and thrown exceptions are attached to the span.
Only capture parameters that are safe to export. They may contain passwords, personal information, or other sensitive data.
Kubernetes installation
On Kubernetes, use an init container to copy the agent into an emptyDir volume before the application starts:
spec:
  initContainers:
    - name: profiler-installer
      image: <your-profiler-installer-image>
      command: ["/bin/sh", "-c"]
      args:
        - |
          case "$(uname -m)" in
            x86_64) runtime=linux-x64 ;;
            aarch64) runtime=linux-arm64 ;;
            *) exit 1 ;;
          esac
          mkdir -p /shared-profiler/native /shared-profiler/agent
          cp /installer/profiler/native/$runtime/libclr_profiler.so \
             /shared-profiler/native/libclr_profiler.so
          cp -a /installer/profiler/agent/net /shared-profiler/agent/
      volumeMounts:
        - name: profiler
          mountPath: /shared-profiler

  containers:
    - name: app
      image: <your-application-image>
      env:
        - name: CORECLR_ENABLE_PROFILING
          value: "1"
        - name: CORECLR_PROFILER
          value: "{CF0D821E-299B-5307-A3D8-B283B7B0F2FD}"
        - name: CORECLR_PROFILER_PATH
          value: /opt/profiler/native/libclr_profiler.so
        - name: AGENT_HOME
          value: /opt/profiler
        - name: AGENT_SETTINGS_PATH
          value: /opt/profiler/settings
      volumeMounts:
        - name: profiler
          mountPath: /opt/profiler

  volumes:
    - name: profiler
      emptyDir: {}
Mount settings.yaml from a ConfigMap into /opt/profiler/settings/settings.yaml. The installer image must copy the correct linux-x64 or linux-arm64 native library. Using an init container prevents a race between installing the profiler and starting .NET.
Current metrics and outlook
The agent currently supports:
- ASP.NET Core and
HttpClientmetrics - .NET runtime and process metrics on .NET 9 or newer
- OTLP metric export to Dynatrace or an OpenTelemetry Collector
- configurable service names and collection intervals
The next planned areas are:
- additional OpenTelemetry providers and instrumentation integrations
- online agent configuration through the Open Agent Management Protocol (OpAMP)
- production-ready ReJIT capabilities, allowing updated method rules to be applied to an already running application
- log ingestion and trace correlation for:
Microsoft.Extensions.Logging- Serilog
- log4net
OpAMP is intended to deliver configuration updates centrally. ReJIT will then allow affected methods to be instrumented again without restarting the application. Log ingestion is not available yet; the goal is to export logs together with traces and metrics while preserving their trace and span context.
Troubleshooting
If no telemetry appears, check the package architecture, OTLP endpoint and protocol, Dynatrace token permissions, and AGENT_SETTINGS_PATH. Set RUST_LOG=debug before starting the application for more profiler diagnostics.