Instrumenting .NET AWS Lambda Functions with net_profiler_rust
In the first net_profiler_rust article I used the profiler with local .NET applications. The same approach also works with AWS Lambda: a Lambda layer installs the profiler and starts OpenTelemetry without adding OpenTelemetry code or packages to the function.
The layer supports the managed dotnet8 and dotnet10 Lambda runtimes on ARM64 and x86_64. This example uses .NET 10 and ARM64 because the current AWS SDK instrumentation is included in the .NET 10 agent package.
Create a DynamoDB Lambda
Install the AWS Lambda templates and deployment tool:
dotnet new install Amazon.Lambda.Templates
dotnet tool install -g Amazon.Lambda.Tools

dotnet new lambda.EmptyFunction -n LambdaProfilerDemo
cd LambdaProfilerDemo/src/LambdaProfilerDemo
dotnet add package AWSSDK.DynamoDBv2
Change the project target framework to net10.0, then use this handler:
using Amazon.DynamoDBv2;
using Amazon.DynamoDBv2.Model;
using Amazon.Lambda.Core;
using Amazon.Lambda.Serialization.SystemTextJson;

[assembly: LambdaSerializer(typeof(DefaultLambdaJsonSerializer))]

namespace LambdaProfilerDemo;

public sealed record CalculatorInput(string Id, int Left, int Right);
public sealed record CalculatorResult(string Id, int Left, int Right, int Result);

public sealed class Function
{
    private readonly IAmazonDynamoDB dynamoDb = new AmazonDynamoDBClient();
    private readonly string tableName =
        Environment.GetEnvironmentVariable("TABLE_NAME") ?? "lambda-profiler-demo";

    public async Task<CalculatorResult> FunctionHandler(
        CalculatorInput input, ILambdaContext context)
    {
        var result = input.Left / input.Right;

        await dynamoDb.PutItemAsync(new PutItemRequest
        {
            TableName = tableName,
            Item = new()
            {
                ["id"] = new() { S = input.Id },
                ["left"] = new() { N = input.Left.ToString() },
                ["right"] = new() { N = input.Right.ToString() },
                ["result"] = new() { N = result.ToString() }
            }
        });

        var stored = await dynamoDb.GetItemAsync(new GetItemRequest
        {
            TableName = tableName,
            Key = new() { ["id"] = new() { S = input.Id } },
            ConsistentRead = true
        });

        return new(
            input.Id,
            int.Parse(stored.Item["left"].N),
            int.Parse(stored.Item["right"].N),
            int.Parse(stored.Item["result"].N));
    }
}
Create the table:
aws dynamodb create-table \
  --region eu-central-1 \
  --table-name lambda-profiler-demo \
  --attribute-definitions AttributeName=id,AttributeType=S \
  --key-schema AttributeName=id,KeyType=HASH \
  --billing-mode PAY_PER_REQUEST
The Lambda execution role needs the normal CloudWatch Logs permissions plus dynamodb:PutItem and dynamodb:GetItem for this table. Deploy the function as ARM64:
dotnet lambda deploy-function lambda-profiler-demo \
  --region eu-central-1 \
  --framework net10.0 \
  --function-runtime dotnet10 \
  --function-architecture arm64 \
  --function-handler LambdaProfilerDemo::LambdaProfilerDemo.Function::FunctionHandler \
  --function-role <lambda-role-arn> \
  --function-timeout 30 \
  --function-memory-size 512 \
  --environment-variables TABLE_NAME=lambda-profiler-demo
Download and configure the profiler layer
Open the net_profiler_rust download page, select the latest release, and open its lambda-layers directory.
Download the package matching the function architecture:
profiler-lambda-layer-<version>-linux-arm64-package.zipprofiler-lambda-layer-<version>-linux-x64-package.zip
This example uses the ARM64 package. Extract it and enter the package directory:
unzip profiler-lambda-layer-<version>-linux-arm64-package.zip
cd profiler-lambda-layer-<version>-linux-arm64
The downloaded package contains:
- the layer ZIP
deploy-layer.shfunction-environment.json- the expanded
/optlayout and generatedsettings.yaml
Edit layer/profiler/settings/lambda/settings.yaml for Dynatrace:
General:
  Enabled: true
  Provider: dynatrace
  Type: awslambda

Connection:
  EndpointUrl: https://<environment>/api/v2/otlp
  Type: http
  BearerToken: <token>

Monitoring:
  ServiceName: lambda-profiler-demo
  Enabled: true
  Special:
    - AWS
  Metrics:
    ServiceName: lambda-profiler-demo
    Enabled: false
    CollectionInterval: 10
    Cpu: false
    Memory: false
Recreate the layer ZIP so it contains the modified settings:
LAYER_ZIP="$(find . -maxdepth 1 -name 'profiler-lambda-layer-*-linux-arm64.zip' -print -quit)"
rm "$LAYER_ZIP"
(cd layer && zip -qr "../$LAYER_ZIP" .)
The layer installs the startup wrapper, native profiler, managed agent assemblies, and settings under /opt. The Dynatrace token is now embedded in this private layer, so do not publish the ZIP or layer publicly.
Publish and attach the layer
The included deployment script publishes the layer, attaches it to the function, and merges the required profiler environment variables:
chmod +x deploy-layer.sh
./deploy-layer.sh net-profiler-rust lambda-profiler-demo eu-central-1
The script reads the layer ZIP and function-environment.json from the extracted package. On a later deployment, remove an obsolete version of this layer from the function if it is still attached.
For an x86_64 Lambda, download the linux-x64-package.zip instead. Its deployment script publishes the layer with the matching architecture.

profiler_wrapper.Invoke and verify
Invoke the function with an explicit payload:
aws lambda invoke \
--region eu-central-1 \
--function-name lambda-profiler-demo \
--cli-binary-format raw-in-base64-out \
--payload '{"id":"article-demo","left":84,"right":2}' \
response.json
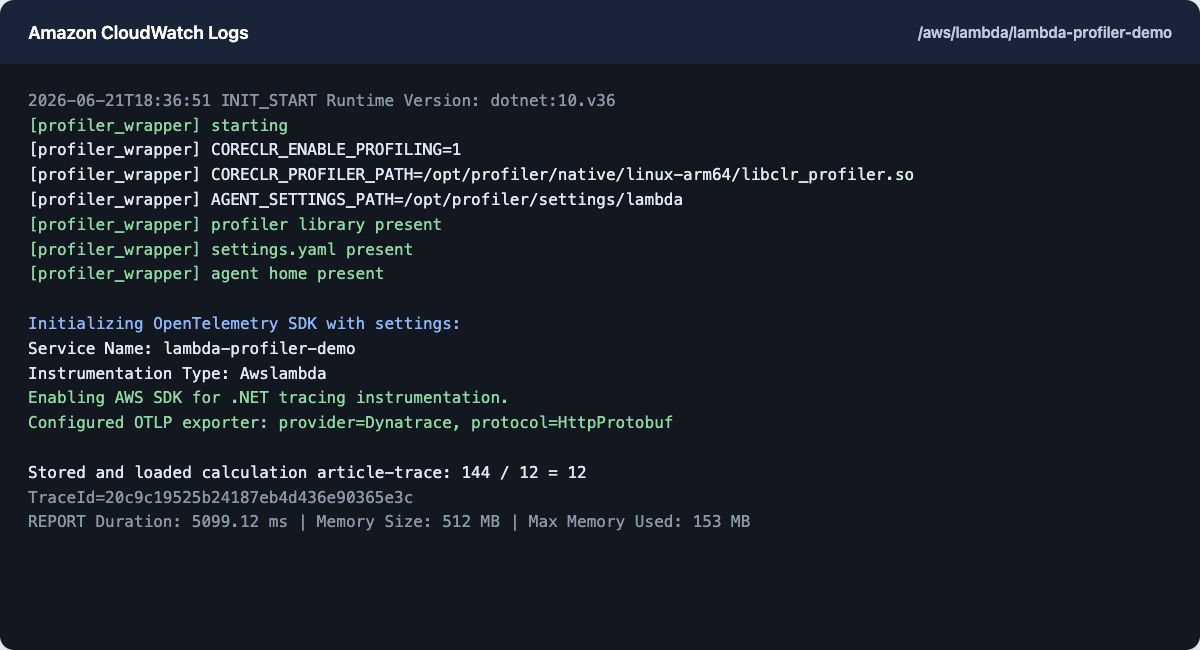
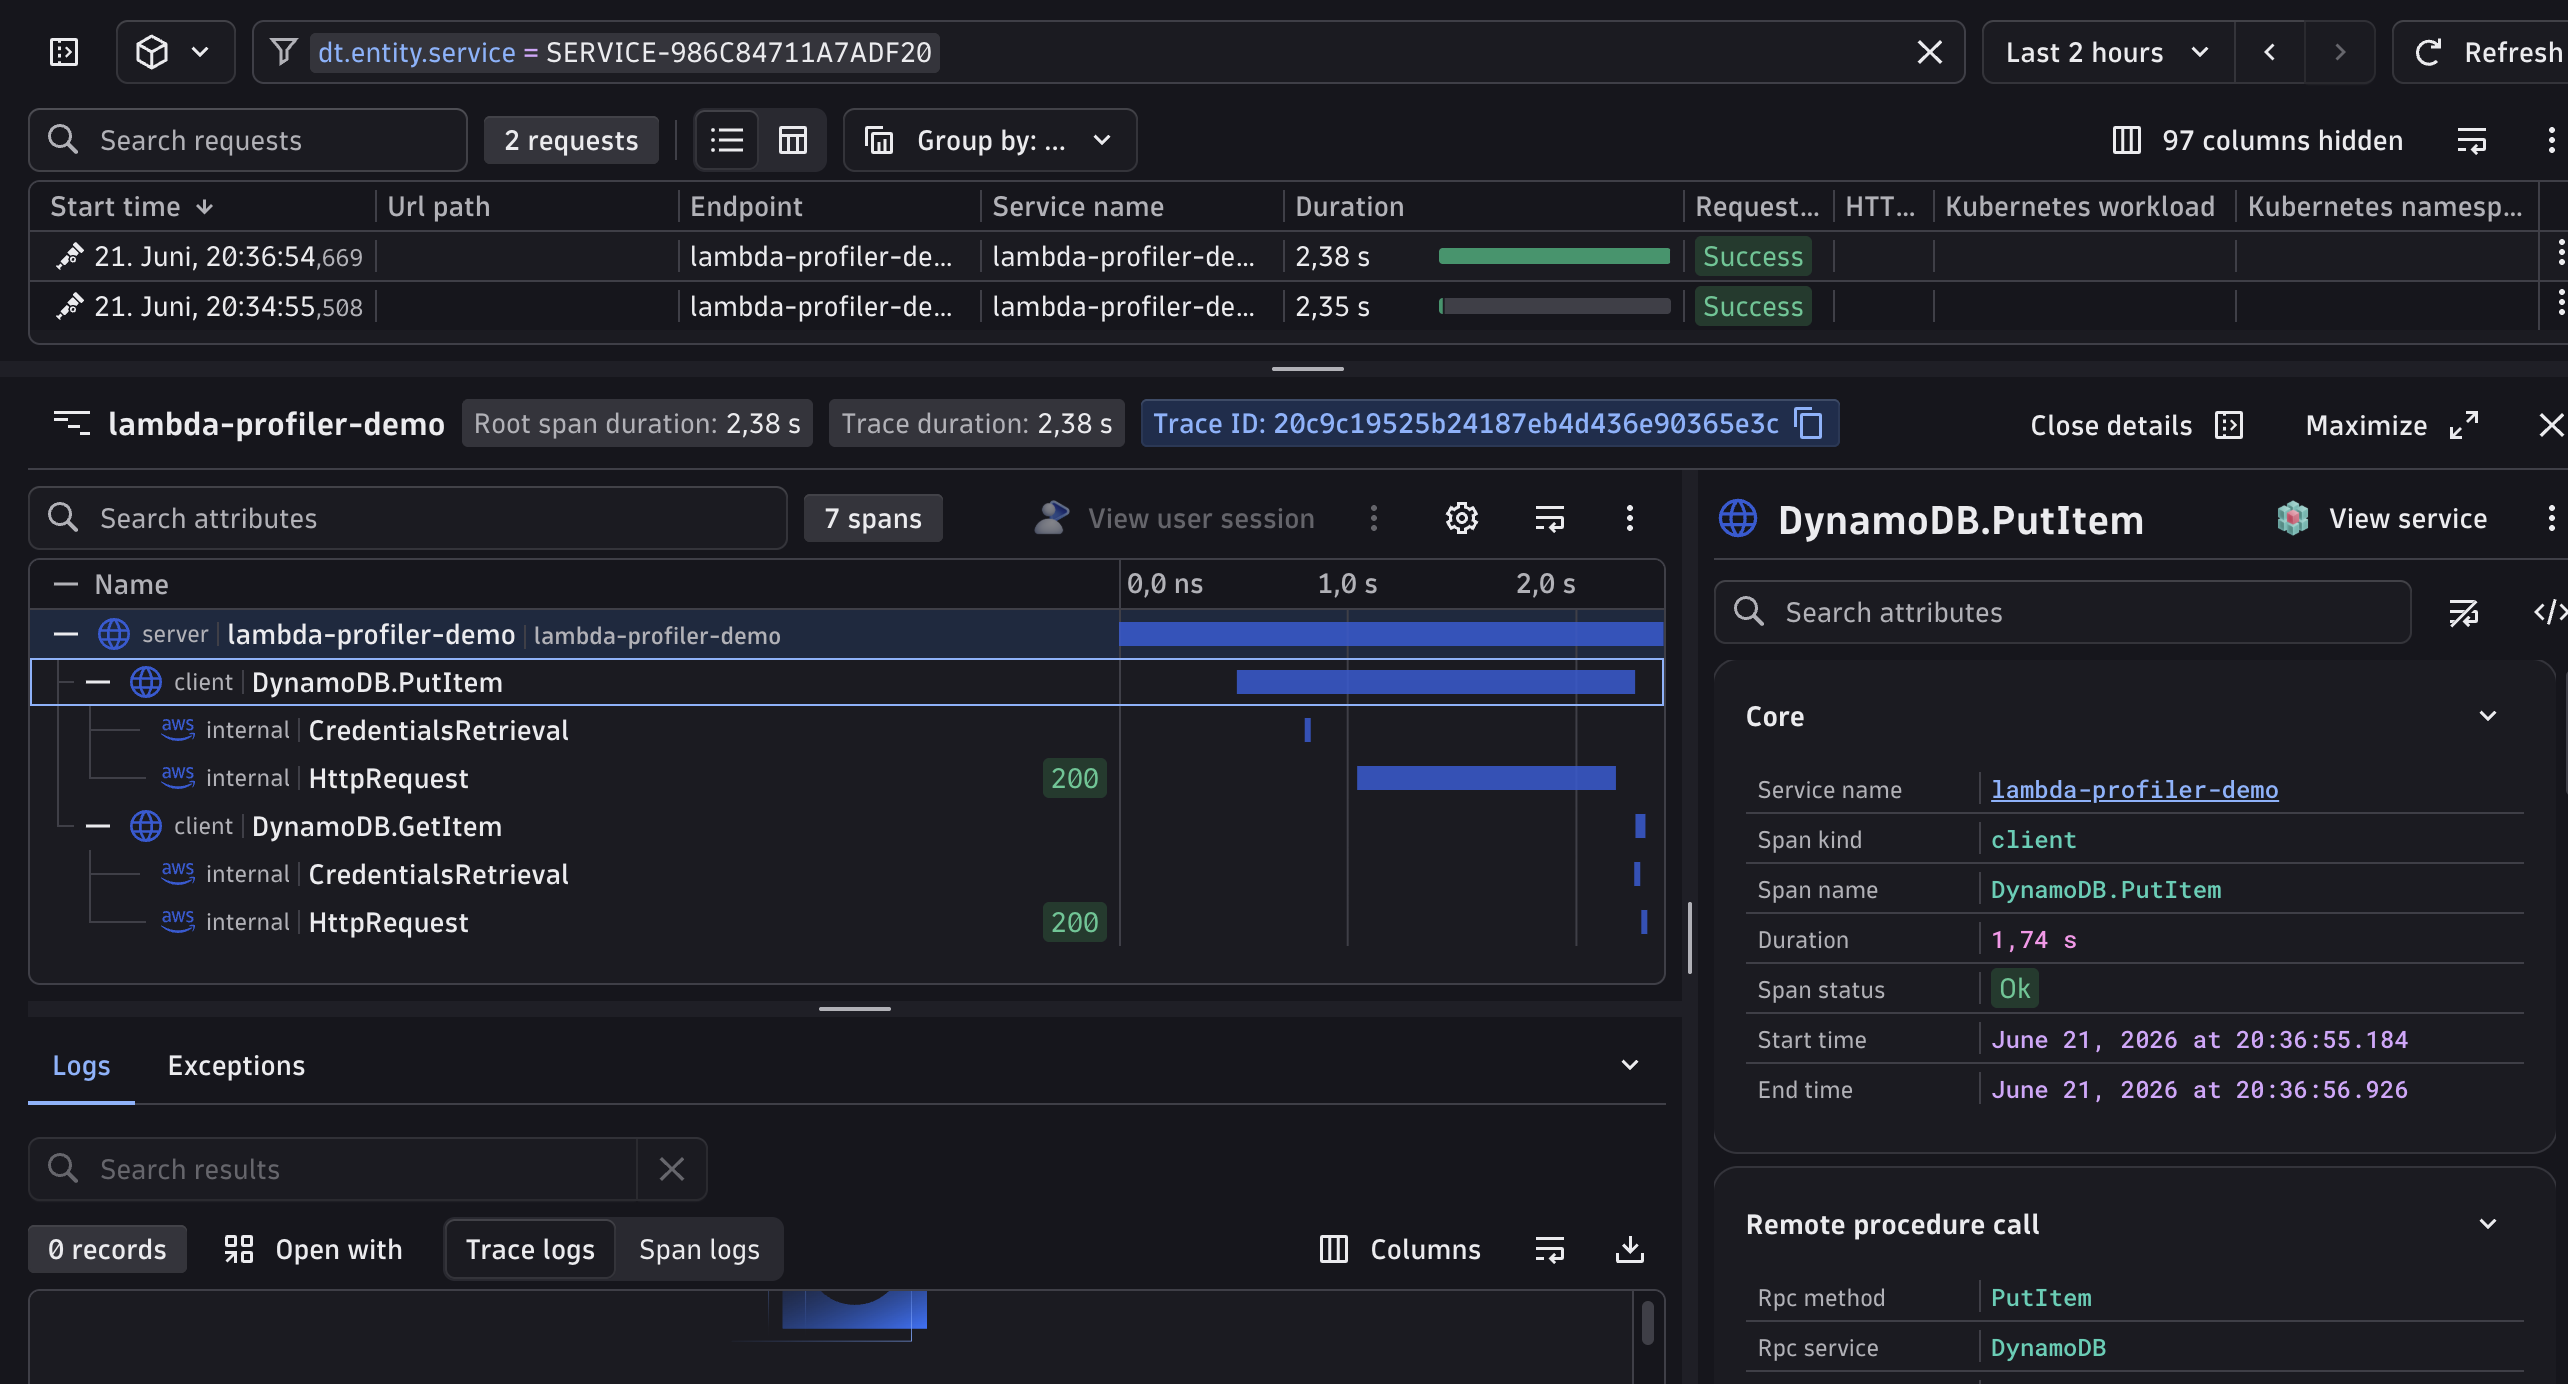
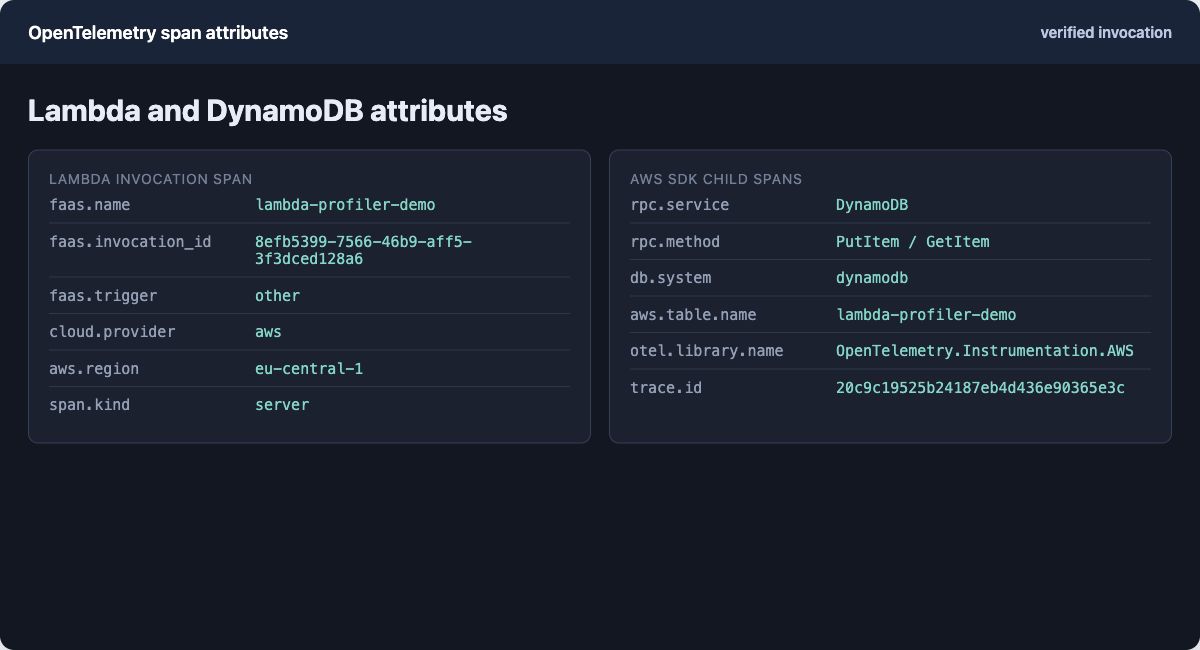
cat response.json
CloudWatch should contain lines prefixed with [profiler_wrapper]. In Dynatrace, the Lambda invocation appears as a server span with the function name, version, invocation ID, ARN, region, and trigger type. PutItem and GetItem appear as child spans. The agent flushes traces and metrics before the invocation returns.
Supported AWS instrumentation
There are two separate types of instrumentation:
- Incoming Lambda triggers: API Gateway and ALB HTTP events, scheduled EventBridge events, S3, DynamoDB Streams, SQS, SNS, Kinesis, Kafka, Amazon MQ, and EventBridge.
- Outgoing AWS SDK calls: AWS SDK for .NET clients, including services such as DynamoDB, S3, SQS, SNS, Secrets Manager, and STS.
HttpClient and gRPC client tracing can also be enabled in Monitoring.Special. AWS SDK tracing currently uses OpenTelemetry.Instrumentation.AWS 1.11.0. Its semantic conventions are still beta, and the service list above is illustrative rather than an exhaustive compatibility guarantee.
Future: Azure Functions
Azure Functions support is planned, beginning with the .NET isolated worker model. The intended direction includes automatic invocation spans, trigger classification, Azure SDK client instrumentation, OTLP export, end-of-invocation flushing, and a deployment package comparable to the AWS Lambda layer workflow. There is no release date yet.