net_profiler_rust 0.7: OpenTelemetry Logs for .NET
net_profiler_rust 0.7 adds log ingestion to the existing OpenTelemetry trace and metric support. The profiler can now export logs from common .NET logging stacks without adding OpenTelemetry code or packages to the instrumented application.
The first versions of the profiler focused on traces and metrics. That already made it possible to see ASP.NET Core requests, outgoing HTTP calls, selected custom method spans, runtime metrics, and process metrics. Version 0.7 closes an important gap: logs can now travel through the same OTLP configuration and keep their trace and span context when they are written inside an active .NET Activity.
What is new in 0.7
The new log pipeline supports:
Microsoft.Extensions.Logging- Serilog
- log4net
- OTLP export to a collector or backend
- Dynatrace ingest through the OpenTelemetry API
- trace and span correlation through
Activity.Current - configurable minimum log level, scopes, formatted messages, and structured state values
Logs are disabled by default. Existing profiler settings keep the same behavior until the Monitoring.Logs section is added and enabled.
Why log correlation matters
Traces are very good at showing the request path and timing. Logs are better for the detailed statements developers already write while handling a request, executing a job, or catching an exception.
The useful part is the connection between both signals. If an ASP.NET Core controller writes an ILogger<HomeController> message while a request span is active, version 0.7 exports the log record with the active trace ID and span ID. In Dynatrace, or in another backend that understands OpenTelemetry logs, the log can then be shown together with the trace.
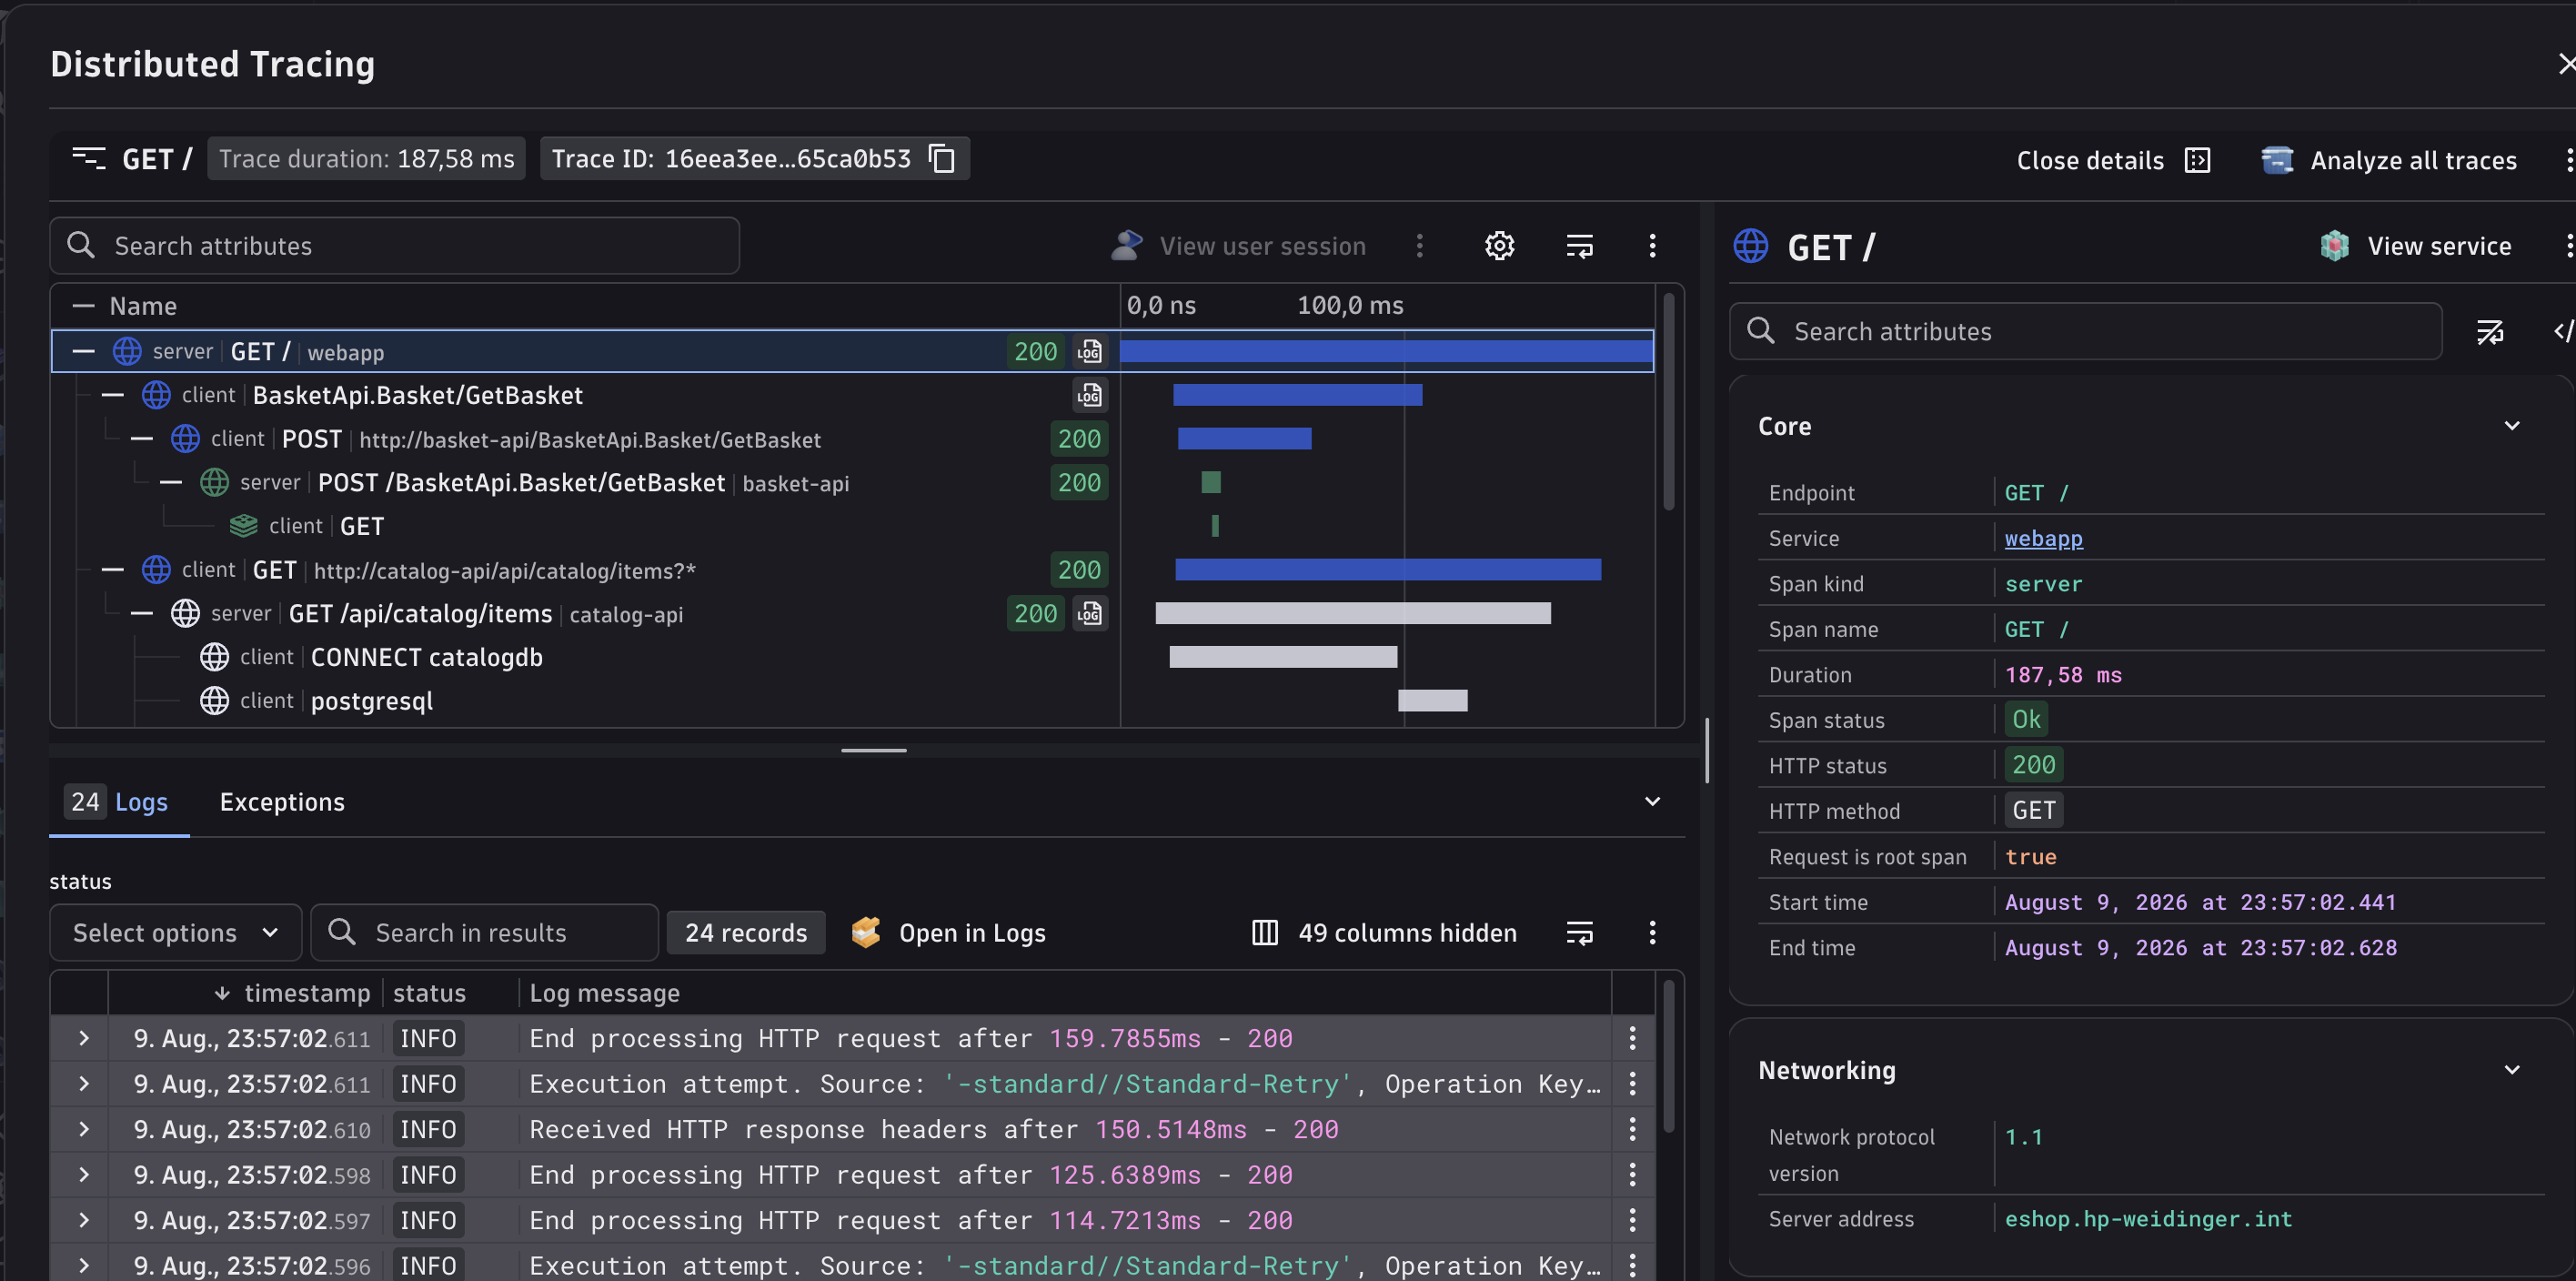
Enabling logs
Add a Logs section below Monitoring in settings.yaml:
General:
  Enabled: true
  Provider: dynatrace
  Type: aspnetcore

Connection:
  EndpointUrl: https://<your-environment>.live.dynatrace.com/api/v2/otlp
  Type: http
  BearerToken: <your-api-token>

Monitoring:
  ServiceName: demo-api
  Enabled: true
  Special:
    - HttpClientInstrumentation

  Metrics:
    ServiceName: demo-api
    Enabled: true
    CollectionInterval: 10
    Cpu: true
    Memory: true

  Logs:
    Enabled: true
    MinimumLevel: Information
    IncludeFormattedMessage: true
    IncludeScopes: true
    ParseStateValues: true
    CaptureTraceContext: true
    Providers:
      MicrosoftExtensionsLogging:
        Enabled: true
      Serilog:
        Enabled: true
      Log4Net:
        Enabled: true
For Provider: dynatrace, the profiler derives the log ingest endpoint from the configured OTLP base URL and sends logs to:
https://<your-environment>.live.dynatrace.com/api/v2/otlp/v1/logs
The export protocol for Dynatrace logs is HTTP/protobuf. The bearer token from the settings file is sent as a Dynatrace API token header. The token needs the Dynatrace OpenTelemetry log ingest permission in addition to the trace and metric ingest permissions used by earlier profiler versions.
For Provider: otel, the configured endpoint is used directly, just like with traces and metrics. This is useful when sending telemetry to an OpenTelemetry Collector:
General:
  Enabled: true
  Provider: otel
  Type: aspnetcore

Connection:
  EndpointUrl: http://localhost:4318/v1/logs
  Type: http

Monitoring:
  ServiceName: demo-api
  Enabled: true
  Logs:
    Enabled: true
    MinimumLevel: Information
    IncludeFormattedMessage: true
    IncludeScopes: true
    ParseStateValues: true
    CaptureTraceContext: true
    Providers:
      MicrosoftExtensionsLogging:
        Enabled: true
Microsoft.Extensions.Logging
For hosted ASP.NET Core applications the profiler wires OpenTelemetry into the application logging builder. This covers the normal ILogger<T> path used by controllers, minimal APIs, hosted services, middleware, and framework components.
Example application code does not need to know about OpenTelemetry:
public sealed class HomeController : Controller
{
    private readonly ILogger<HomeController> logger;

    public HomeController(ILogger<HomeController> logger)
    {
        this.logger = logger;
    }

    public IActionResult Index()
    {
        logger.LogInformation(
            "Home page handled for cart {CartId}",
            HttpContext.TraceIdentifier);

        return View();
    }
}
When the request is traced, the exported log record carries the same trace and span identity.
Serilog and log4net
Version 0.7 also includes direct bridges for applications that use Serilog or log4net directly instead of routing everything through Microsoft.Extensions.Logging.
The bridges are activated only when the matching provider is enabled in settings and the logging framework is loaded by the application. They forward log events into the profiler’s OpenTelemetry logging pipeline. They do not create additional spans; they only attach the current trace context when one exists.
This keeps the behavior predictable:
- request logs written inside an ASP.NET Core request can be correlated with the request span
- background logs written inside a custom instrumented span can be correlated with that span
- logs written outside an active
Activityare still exported, but without trace and span IDs
Local validation
The feature is covered by settings tests, managed exporter tests, bridge tests, and local integration tests. The integration test runs the ASP.NET MVC sample under the profiler, enables logs, emits an ILogger<HomeController> message from a request action, and checks that a local OTLP HTTP capture server receives /v1/logs.
The Dynatrace contract test uses a local capture server as well. It verifies that Provider: dynatrace sends logs to /api/v2/otlp/v1/logs, uses HTTP/protobuf, and includes the Dynatrace API token header.
During testing, one small but important transport issue surfaced: the OpenTelemetry exporter can send HTTP requests with Transfer-Encoding: chunked. The local capture server now reads chunked OTLP request bodies correctly, so log assertions inspect the actual protobuf payload instead of an empty request body.
Upgrading
Download version 0.7 from the net_profiler_rust download page, update your profiler package, and add Monitoring.Logs to the settings file.
If you use Dynatrace, make sure the token can ingest OpenTelemetry logs. If you use an OpenTelemetry Collector, add a log pipeline to the collector configuration and point the profiler at the collector’s OTLP log endpoint.
The defaults are conservative: if Monitoring.Logs is omitted, no logs are exported.